ggplot2: Data visualization on "Vehicle accidents" dataset
What is ggplot?
ggplot2 is the most popular and fully featured data visualization package for the R programming language. It allows to build and customize the graphics using the concept of grammar of graphics.
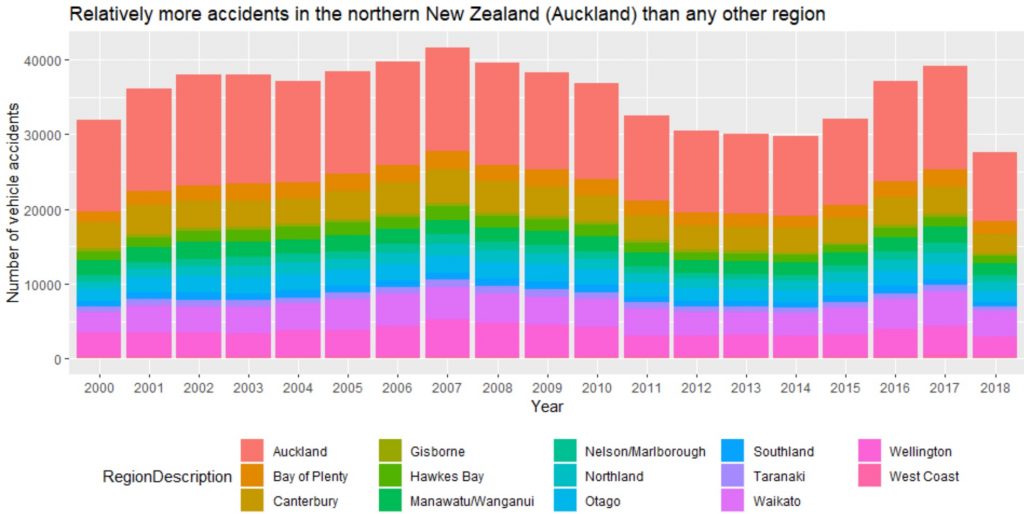
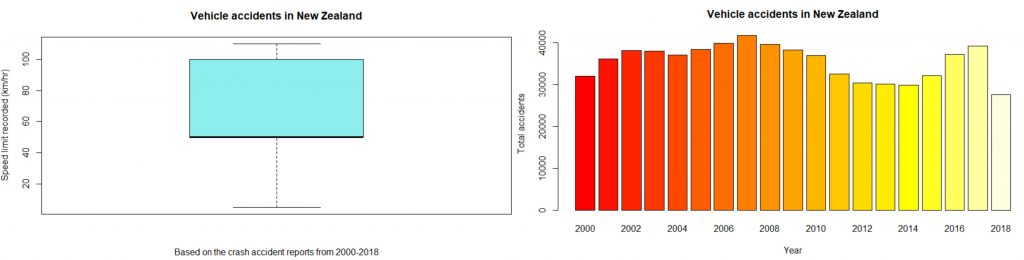
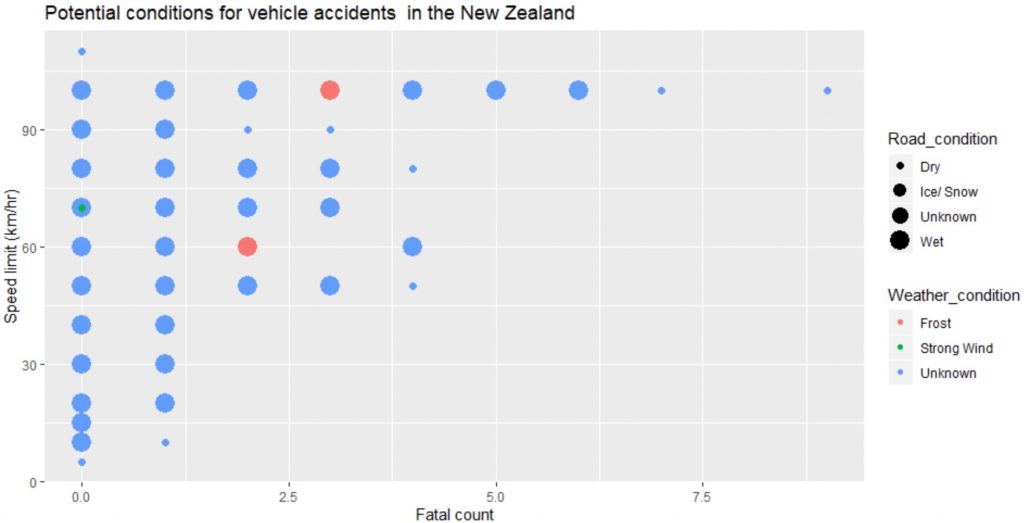
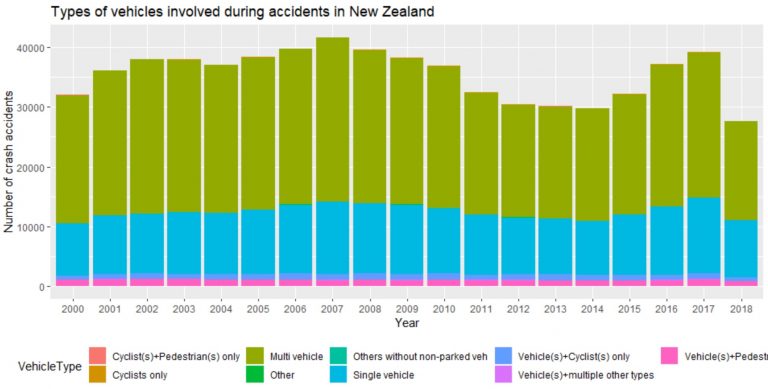
I used ggplot2 on the dataset “Vehicle accidents” to produce below visualization, and I must say it is one of the powerful techniques in R to showcase customizable data graphics.
Dataset info:
NZ Police reports all the traffic crash data is to the Transport Agency. The Agency then feeds all the reported data into Crash Analysis System (CAS). By default, all crashes in the New Zealand roadways or any areas where public have legal access is recorded in the CAS. The dataset used in this case includes crash variables, with no personal data.