Resuscitate your Data

Animation in R (using gganimate and ggplot2)

Picture of Raj

Raj

Prerequisite:
library(ggplot2)
library(gganimate)

PLOT 1

Dataset info: Baby Name popularity over time – number of birth registrations for each first name, from 1900 onward in New Zealand. It also includes the year of birth registration, and not the year the baby was born.

Dataset: Source

PLOT 2

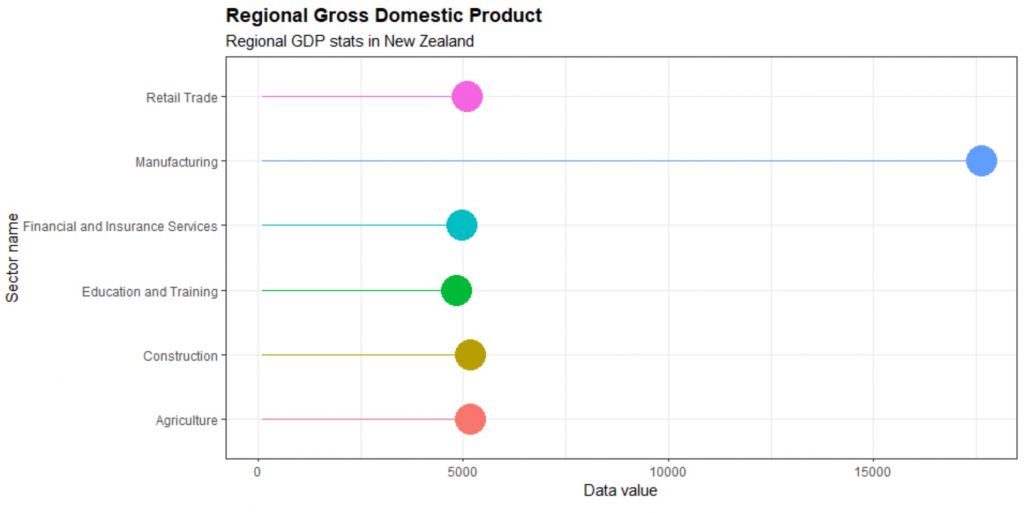
Dataset info: Regional Gross Domestic Product – The dataset includes information on Regional GDP across different geographic breakdowns within NZ. This information also provides a benchmark for measuring changes to regional economies over time.

Dataset: Source

Instructions:

– the above plot is a static Lollipop chart on the Regional GDP dataset in New Zealand across 6 different sectors for the specific year (2000)

– to simplify the plot had to choose just one location (“New Zealand”) for the variable Series_title_2

– all the values under the variable Period needs to be converted to numeric to align with the aesthetics under ggplot2

PLOT 3

Instructions:

– above is the animated Lollipop chart for the Regional GDP dataset in New Zealand across 6 different sectors for the years (2000-2017)

– save your animation using anim_save

– the animated GIF file is saved in the path (C:\Users\<username>\Documents)